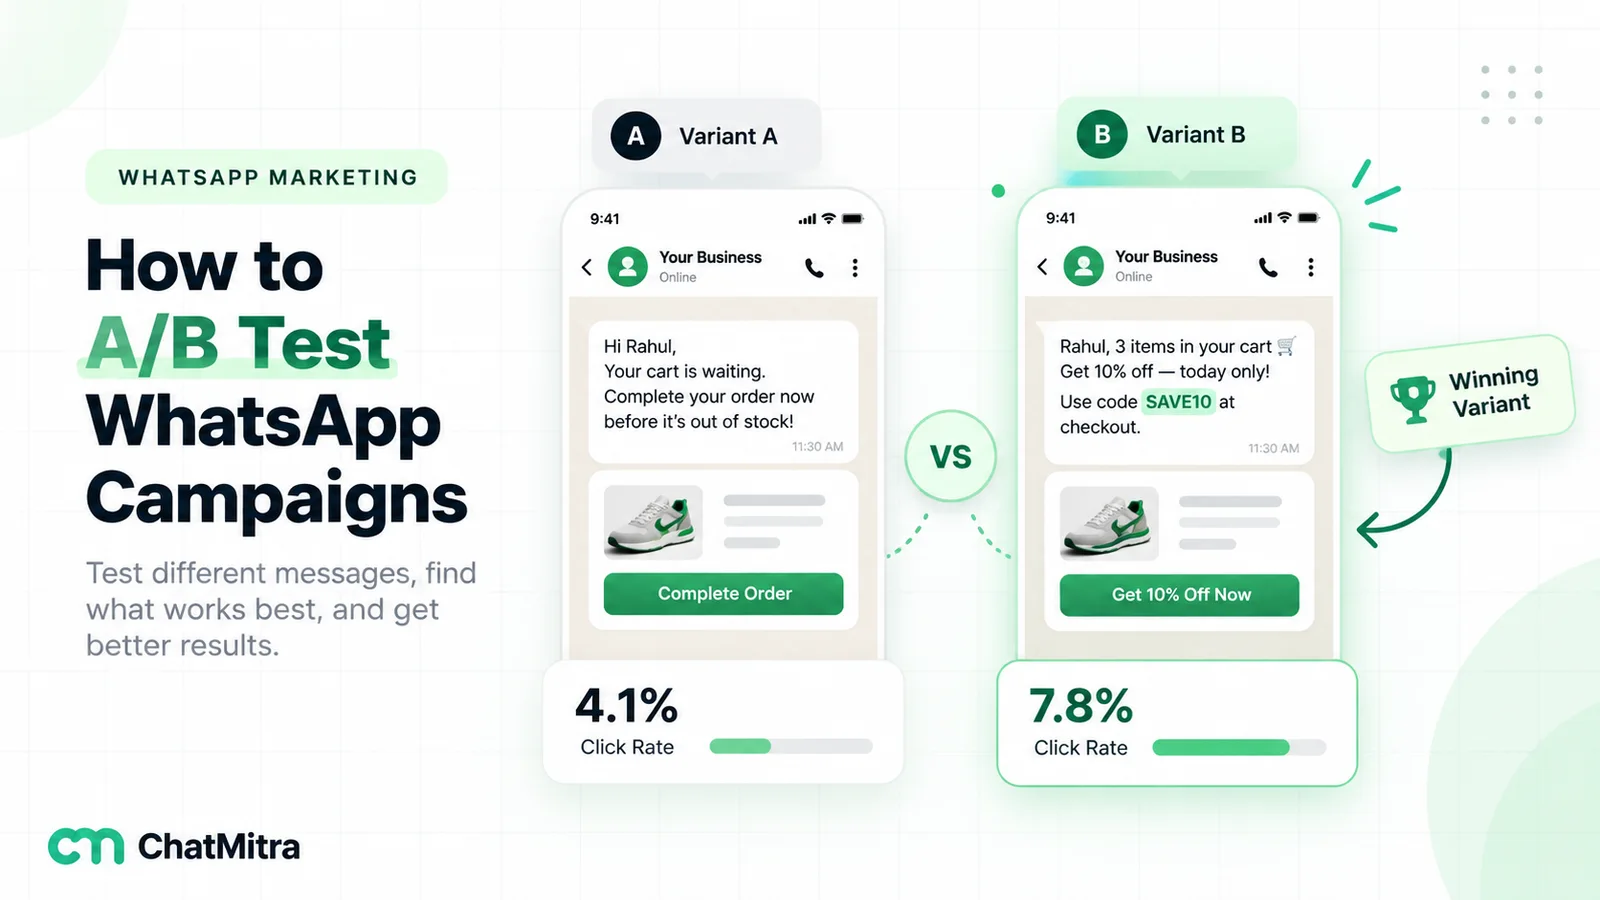
WhatsApp A/B testing means sending two versions of a marketing campaign to two random groups from the same audience, at the same time, and comparing one metric you chose in advance. Only one thing changes between the versions, such as the opening line, the image, the offer or the button text. On WhatsApp each version is a separate approved template, every message costs money, and lists are smaller than email lists, so tests have to be planned rather than improvised.
This guide shows you how to run tests you can trust. It covers what to test and in what order, how to split a list fairly, how many contacts each version needs, which metrics to use, how to tell a real winner from luck, and the WhatsApp-specific traps that make results misleading. It ends with a step-by-step method for ChatMitra, which has no built-in A/B tool, so you’ll see exactly how to do it by hand.
Key takeaways
- Change one thing, split at random, send both versions at the same time, and pick the winning metric before you send.
- Each message variant is its own template. Create both together, in the same category and language, so approval and template pacing treat them alike.
- Sample size decides what you can detect. About 2,200 delivered messages per version detects a click rate moving from 5% to 7%. Small lists need bold changes.
- Don't stop a test early because one version is ahead. Fix the window (for example 72 hours) and judge it then.
- Test on a slice, then send the winner to the rest. The test messages are part of the campaign, so the test itself costs almost nothing extra.
What an A/B test is, and why WhatsApp needs a slightly different approach
An A/B test (also called a split test) is a controlled comparison. You split an audience into random groups, show each group a different version, and measure the difference in one outcome. Random assignment is the whole trick: because the groups are alike in every other way, a difference in results can be credited to the change you made.
A few related terms you’ll meet:
- Control: the version you’d normally send (A). The challenger is B.
- Holdout: a random group that gets no message at all. Use it to measure whether a campaign or automation works at all, as in our abandoned cart recovery guide.
- A/A test: two groups get the identical message. The results should match; if they don’t, your method is broken.
- Multivariate test: several elements change at once in combination. It needs far bigger audiences than most WhatsApp lists have, so this guide sticks to A/B.
Email marketers have done this for years, and the logic transfers. What changes on WhatsApp is the mechanics:
| Factor | Email A/B test | WhatsApp A/B test |
|---|---|---|
| Creating a variant | Edit and send | Each variant is a new template that Meta must approve first |
| Cost of each message | Close to zero | Meta's marketing rate per delivered message (₹0.8631 in India) plus your provider's fee |
| Typical list size | Often large | Usually smaller, because every contact must have opted in to WhatsApp |
| Delivery | Spam filters | Per-user marketing limits, template pacing, a small experiment group that gets no marketing messages |
| Built-in metrics | Opens and clicks in the email tool | Sent, delivered and read from status webhooks; button clicks from Meta's template analytics |
| Main risk of a bad variant | Unsubscribes | Blocks and reports, which can lower your number's quality rating |
Why testing pays off more on WhatsApp than on email
Because every WhatsApp marketing message is paid for, a better message is worth real money. Take a store that sends one campaign a month to 20,000 contacts in India. At Meta’s marketing rate that’s about ₹17,262 in Meta charges per send, before the provider’s fee. If a tested opening line lifts the click rate from 5% to 6%, the store gets roughly 200 extra visits from every later campaign at no extra cost. The spend stays the same, but it works harder.
The second reason is that there’s no reliable outside benchmark. You’ll often see figures like a “98% open rate” repeated in WhatsApp marketing content, usually without a primary source or any definition of “open”. Meta’s developer documentation doesn’t publish a platform-wide average read or click rate. What matters is your own baseline: the read and click rates of your last few campaigns to your own audience. A test compares you with yourself, which is the only comparison you can act on.
Third, a test turns arguments into evidence. “Our customers prefer Hindi”, “videos beat photos”, “evenings work better”: each of these is a hypothesis until you’ve split an audience and checked. After a few tests, the team stops debating the copy and starts looking at its test log.
What you can test in a WhatsApp campaign
Almost any part of a campaign can be tested, but some elements matter more than others. Here they are, roughly in order of likely impact:
| Element | Example A vs B | Needs two templates? | Best metric |
|---|---|---|---|
| The offer | Free delivery vs 10% off | Yes | Orders or revenue per delivered |
| Opening line | Lead with the benefit vs lead with the price | Yes | Read rate, then clicks |
| Header media | Product photo vs short video vs no header | Yes | Clicks per delivered |
| Call-to-action button | "Shop the sale" vs "See my offer" | Yes | Clicks per delivered |
| Button type | URL button vs quick-reply "Interested" | Yes | Replies or orders (clicks aren't comparable) |
| Length | Two lines vs a short paragraph with details | Yes | Clicks per delivered |
| Personalisation | First name in line one vs none | Usually yes | Read rate, clicks |
| Language | English vs Hindi for a regional audience | Yes (each language is its own template) | Clicks, replies |
| Send time | 11 a.m. vs 7 p.m. | No | Read rate within 24 hours, clicks |
| Audience or segment | Recent buyers vs lapsed buyers | No, but this isn't a true A/B test (see below) | Orders per delivered |
A note on that last row. Comparing two segments tells you which segment responds better, which is useful, but the groups weren’t randomly assigned. So you can’t say the message caused the difference. To test a message, split randomly within one segment.
Choose your metric before you send
Picking the metric after seeing the results is the most common way to “find” a winner that isn’t one. Decide in advance, and write it down.
| Metric | Calculation | Where to get it | Watch out for |
|---|---|---|---|
| Delivery rate | Delivered ÷ sent | Your provider's campaign report | Mostly reflects list quality and WhatsApp's limits, not your copy. Use it as a check, not a winner metric |
| Read rate | Read ÷ delivered | Campaign report, template analytics | Meta defines "read" as the message being displayed in the WhatsApp client, so it's a signal of attention, not proof of reading |
| Click rate | Button clicks ÷ delivered | Meta's template analytics (per template) | Only URL and quick-reply buttons are counted, and only for marketing and utility templates |
| Reply rate | Contacts who replied ÷ delivered | Your inbox, counted by hand or by tag | Many tools don't report it per campaign |
| Orders or revenue per delivered | Orders from the variant's link ÷ delivered | Store analytics with a UTM tag per variant | Needs tagged links; the most meaningful metric when you can get it |
| Block or opt-out rate | Opt-outs ÷ delivered | Inbox, quality rating | A "winning" variant that doubles blocks isn't a winner |
Meta’s template analytics are the main source for clicks. They report how many times each template was sent, delivered and read, and how many times its URL or quick-reply buttons were clicked, with daily figures and a 90-day lookback. Three limits matter for testing:
- Reads and clicks are counted for up to 7 days after sending. After that, Meta stops recording them for those messages.
- Template analytics must be switched on (“confirmed”) for your account, either in WhatsApp Manager or through the API. Once confirmed it can’t be switched off. Link tracking can be turned off per template, so check it’s on for both variants.
- They aren’t available everywhere. Meta excludes accounts tied to the EU or Japan and phone numbers with those country codes.
Because template analytics work per template, a test built from two separate templates gives you a clean click comparison for free. It’s one more reason to create each variant as its own template, even for small copy changes. Our template analytics explainer walks through reading these numbers.
For orders, give each variant’s URL button a different UTM tag (for example utm_campaign=diwali&utm_content=variant_a). Your store or web analytics can then report orders per variant.
How to run a WhatsApp A/B test: step by step
Step 1: Write a hypothesis
A hypothesis states the change, the expected effect and the reason. “Leading with free delivery instead of 10% off will raise orders per delivered message, because delivery cost is our most common checkout objection.” It keeps the test focused, and it makes the result useful even when the challenger loses.
Step 2: Change one thing
If variant B has a new image, a new first line and a new button, and it wins, you won’t know which change did it. One variable per test. If you want to test several ideas, run them one after another, or run an A/B/C test with a larger audience.
Step 3: Work out how many contacts you need
Use the table in the next section. If your list is too small to detect the difference you care about, either test a bolder change or pool the result across several similar campaigns.
Step 4: Split the audience at random
Take one audience of opted-in contacts (for example, “bought in the last 6 months”), and assign each contact to a group at random. A spreadsheet works: add a column with a random number (=RAND() in Google Sheets or Excel), sort by it, and label the first block A, the next block B and the rest “remainder”. Never split by name, city, signup date or phone number order. Those groups differ in ways that bias the result.
A common and efficient layout is test-then-send: 10% get A, 10% get B, and after the test window the remaining 80% get the winner.
Step 5: Create both templates together
Submit A and B at the same time, in the same category (normally marketing), the same language and with the same button types, so the only difference is the one you’re testing. Two WhatsApp platform details make this important:
- Template pacing. Meta’s template pacing can hold messages from newly created marketing templates, or templates without a green quality rating, until early feedback comes in. If A is an old, trusted template and B is brand new, B can be held while A goes straight out. Creating two fresh templates puts them on equal footing.
- Automatic creative optimisations. On Meta’s Marketing Messages API, Meta can apply automatic creative changes such as image enhancements or text highlighting. If they apply to one variant and not the other, your test measures Meta’s changes, not yours. Make sure the setting is the same for both templates, ideally off during tests. Our MM Lite guide explains the setting.
Step 6: Send both at the same moment
Schedule both versions for the same time. A version sent at 11 a.m. and another at 4 p.m. differ in timing as well as content, and timing alone can move read rates. Keep every other setting identical too, including retry rules and any follow-up automations.
Step 7: Wait for the full window, then decide
Choose the window before sending: 48–72 hours for read and click tests, up to 7 days for order tests. Then leave it alone. Checking hourly and stopping as soon as one version pulls ahead is a well-known way to produce false winners (more on that below).
Step 8: Roll out the winner and record the result
Send the winner to the remainder. Then write down the hypothesis, the numbers and the decision in a test log. A log turns one-off tests into knowledge your team can reuse.
How many contacts do you need?
This is where WhatsApp testing most often goes wrong. Small tests produce big-looking differences that are just noise.
The required size depends on two things: your current rate (the baseline) and the smallest improvement worth detecting. The table uses the standard settings of 95% confidence and 80% power, meaning an 80% chance of detecting the improvement if it’s real:
| Baseline rate | Improved rate | Delivered messages needed per version | Meta cost for both versions (India, marketing) |
|---|---|---|---|
| 3% clicks | 4% | 5,298 | ₹9,145 |
| 5% clicks | 6% | 8,155 | ₹14,077 |
| 5% clicks | 7% | 2,210 | ₹3,815 |
| 10% clicks | 12% | 3,839 | ₹6,627 |
| 10% clicks | 15% | 683 | ₹1,179 |
| 20% clicks | 25% | 1,091 | ₹1,883 |
| 60% reads | 65% | 1,468 | ₹2,534 |
Sample sizes use the standard two-proportion formula. Costs are both groups × ₹0.8631, Meta’s India marketing rate from 1 October 2026, rounded to the nearest rupee, before any provider fee.
Three things to take from this table:
- Small improvements need big groups. A one-point rise from 5% to 6% needs more than 8,000 delivered messages per version. Most WhatsApp lists can’t detect changes that small in one campaign.
- Bold changes are cheaper to test. Testing a different offer is more likely to produce a big difference than testing a synonym in the button.
- The cost is mostly the campaign itself. In a test-then-send layout, the test groups are people you were going to message anyway. The extra cost is close to zero. You only pay extra if you add a holdout that gets nothing, and even then the “cost” is the sales you might have made from that group.
A quick rule of thumb from Evan Miller’s widely cited guide to A/B testing is n = 16 × σ² ÷ δ² per group, where δ is the smallest difference you want to detect and σ² is the variance (for a rate p, that’s p × (1 − p)). For 5% against 7%, that gives 16 × 0.0475 ÷ 0.0004 = 1,900, close to the exact 2,210. His free sample size calculator does the full calculation.
How to read the result
When the window closes, compare the metric. Then ask whether the gap is bigger than chance would produce. Here are three examples with the same 6% click rate for A:
| Test | Version A | Version B | Chance of a gap this big by luck alone | Verdict |
|---|---|---|---|---|
| 1 | 150 clicks / 2,500 delivered (6.0%) | 205 / 2,500 (8.2%) | About 0.25% | B wins. Roll it out |
| 2 | 150 / 2,500 (6.0%) | 170 / 2,500 (6.8%) | About 25% | No clear winner. Keep A or retest a bolder change |
| 3 | 30 / 500 (6.0%) | 42 / 500 (8.4%) | About 14% | Looks like a win, but the list is too small to be sure |
The percentages are two-sided p-values from a standard two-proportion z-test. The convention is to call a result significant when that chance is below 5%. Test 3 is the trap. B’s lead is as big as in test 1, but with 500 per group it could easily be luck. Report it as “promising, not proven”, and retest it.
Checking significance in a spreadsheet
You don’t need statistics software. Put version A’s clicks and delivered count in cells B2 and C2, and version B’s in B3 and C3. Then add these formulas in Google Sheets or Excel:
Pooled rate (E2):   =(B2+B3)/(C2+C3)
Standard error (F2): =SQRT(E2*(1-E2)*(1/C2+1/C3))
z-score (G2):        =(B3/C3-B2/C2)/F2
p-value (H2):        =2*(1-NORM.S.DIST(ABS(G2),TRUE))
With test 1 from the table (150 of 2,500 against 205 of 2,500), the z-score comes out at about 3.03 and the p-value at about 0.0025, which is the 0.25% shown above. A p-value below 0.05 means a gap this large would be unusual if the two versions actually performed the same.
The formula works for any rate you can count per delivered message: reads, clicks, replies or orders. It assumes the groups were split at random and that each contact counts once. If your click source counts repeat taps by the same person, use a count of unique people instead, for example unique users from your UTM report.
Keep these rules in mind:
- Don’t peek and stop. Evan Miller shows that checking repeatedly and stopping when a result looks significant inflates false winners: “if you peek at an ongoing experiment ten times, then what you think is 1% significance is actually just 5% significance”. Looking is fine; stopping early isn’t.
- Look beyond the headline. Check delivery and failure counts for both versions. If one version had far more failures, the comparison is skewed (see the traps below).
- A small, significant win is still small. If B lifts clicks from 6.0% to 6.3% on a huge list, it’s real but may not change your revenue. Look at orders.
- Losers teach too. If benefit-first lost to price-first three times, that’s a finding worth more than any single campaign.
A worked example, start to finish
Here’s how a complete test might look for a clothing store’s Diwali sale. The audience size and results are illustrative, but the method and the maths are exactly what you’d do.
- Audience: 24,000 customers who bought in the last year and opted in to WhatsApp offers.
- Hypothesis: “Free delivery on every order” will get more clicks per delivered message than “Flat 10% off”, because delivery charges are the most common question in our inbox.
- Primary metric: button clicks per delivered message after 72 hours. Secondary: orders per delivered message after 7 days, from UTM tags.
- Split: random 10% (2,400) get A, 10% (2,400) get B, and 80% (19,200) wait.
- Templates: two new marketing templates submitted the same morning, identical except for the offer line, each with its own UTM tag.
Both were sent at 7 p.m. on the same day. After 72 hours:
| A: 10% off | B: free delivery | |
|---|---|---|
| Delivered | 2,310 | 2,296 |
| Clicks | 127 (5.5%) | 172 (7.5%) |
| Orders after 7 days | 21 (0.91%) | 33 (1.44%) |
On the primary metric, B’s lead has about a 0.6% chance of being luck, so B wins. Orders point the same way, but with a chance of luck near 10% they don’t prove it on their own. That’s normal: orders are rarer than clicks, so they need bigger groups. The store sends B to the remaining 19,200 customers. At Meta’s India marketing rate, that final send costs about ₹16,572 in Meta charges, the same as it would have cost without the test.
Two notes for the log. Delivered counts were almost identical, so failures were balanced. And the next test should build on the finding: free delivery with a minimum order value against free delivery with none.
WhatsApp-specific traps that skew results
These are the issues that make WhatsApp tests go wrong even when the split and the sample size are right.
Failures that hit one version harder. WhatsApp limits how many marketing templates a person receives from all businesses, based partly on their recent read rate. Blocked sends fail with error 131049 (Meta, per-user limits). Separately, Meta runs an ongoing experiment in which “a very small percentage of WhatsApp users do not receive marketing template messages from any business”, and those sends fail with error 130472. With random groups, both effects should hit A and B about equally. Always compare per delivered message, and check the failure counts match.
Template pacing. As covered in step 5, a paced template can be held while its rival goes out. If one version’s delivered count lags for hours, wait until both have finished delivering before comparing.
Unequal timing. Even 30 minutes apart can matter around lunch or evening peaks. Same schedule, always.
Contamination. If the same customer is in both groups (for example, a duplicated contact under two numbers), or group A’s customers forward the offer to group B, the difference shrinks. Deduplicate first.
Novelty effects. A new style of message often does well the first time simply because it’s different. Re-run important winners a few weeks later before making them permanent.
Countries where marketing messages don’t arrive. Meta says WhatsApp “does not currently deliver marketing template messages to WhatsApp users with United States phone numbers”. Exclude US numbers from marketing tests.
Over-testing the same people. Running a test on every campaign to the same small list adds messages and fatigue. Test on your main campaigns, not your everyday ones.
Testing automated flows, not just broadcasts
Broadcasts are the easiest thing to test because you control the audience and the send time. Automated flows, such as welcome messages, cart reminders and post-purchase follow-ups, deserve testing too. They run every day, so a small improvement compounds.
The difficulty is the split. A flow is triggered one customer at a time, so there’s no list to shuffle. Options, from strongest to weakest:
- Random assignment in the trigger. If your tool or developer can assign each new customer to A or B at random when the flow starts, do that. A simple method is to use a digit that is close to random, such as the last digit of an order ID or phone number: even digits get A, odd digits get B. That’s different from sorting a list by phone number, which groups prefixes and operators together.
- Alternating weeks. Run A for a week, then B for a week, and repeat a few times. It’s weaker because weeks differ (salary days, festivals, ad spend), but alternating several times reduces the bias.
- Before and after. Change the flow and compare with last month. This is the weakest option, so only use it for large, obvious changes.
Whichever you use, run the flow test for weeks rather than days, because each day only adds a handful of customers to each group. Measure it the same way as a broadcast: one primary metric per delivered message. In ChatMitra, flows like the Shopify cart reminders send one template per step and have no built-in split, so alternating periods is the practical route there.
Twelve test ideas with hypotheses
| # | Version A | Version B | Hypothesis |
|---|---|---|---|
| 1 | 10% off | Free delivery | Delivery cost is a bigger objection than price for our buyers |
| 2 | Price in the first line | Benefit in the first line | The first line decides whether the message gets read |
| 3 | No header | Product photo header | A picture makes the product recognisable at a glance |
| 4 | Product photo | 6-second product video | Motion shows use better than a still |
| 5 | "Shop now" | "See today's offer" | Specific buttons get more taps than generic ones |
| 6 | URL button | Quick-reply "Tell me more" | A reply starts a sales conversation that converts better than a click |
| 7 | Short (2 lines) | Detailed (sizes, delivery date, returns) | For high-value products, detail answers questions before they're asked |
| 8 | 11 a.m. | 7 p.m. | Our buyers read and shop in the evening |
| 9 | English | Hindi (or the regional language) | The shopper's own language feels more personal |
| 10 | "Sale ends Sunday" | No deadline | A real deadline prompts action (only use deadlines that are true) |
| 11 | Generic greeting | First name plus last product bought | Relevance beats reach |
| 12 | Campaign sent | No campaign (holdout) | The campaign produces sales that wouldn't have happened anyway |
Idea 12 is the one most businesses never run, and it’s the most valuable. It tells you whether your WhatsApp campaigns add revenue or just reach customers who were going to buy anyway. For more campaign concepts to test, see our WhatsApp marketing campaign ideas and broadcast message examples.
A 90-day testing plan
If you’ve never tested, don’t start with twelve ideas at once. A simple quarter-long plan, one main test a month, builds a useful test log without tiring your list:
| Month | Main test | Why this order | Carry forward |
|---|---|---|---|
| 1 | The offer (idea 1) | Biggest likely difference, so even a mid-sized list can detect it | The winning offer becomes the control |
| 2 | Opening line or header media (ideas 2–4) | Decides whether the message gets read at all | Winning format for every later campaign |
| 3 | Send time (idea 8), plus a holdout (idea 12) | Send time is a one-off answer; the holdout checks the whole programme | A default send slot and a measured campaign lift |
After the quarter, retest the month 1 winner against a fresh challenger. Customers change, seasons change, and a winner from a festive sale may not hold in a quiet month. If your list is small (a few thousand contacts), keep the plan but test only bold changes, and pool the same test across two or three campaigns before deciding.
Running an A/B test in ChatMitra
ChatMitra doesn’t have a built-in A/B feature. Each campaign sends one template, and there’s no automatic random split or winner selection. A clean test takes about 15 minutes of setup by hand:
- Export your audience. Export your contacts and keep only the rows you plan to target in this campaign (for example, customers who bought in 2026).
- Randomise in a spreadsheet. Add a column with
=RAND(), sort by it, then add a Tags column: the first 10% getabtest-diwali-a, the next 10%abtest-diwali-b, the restabtest-diwali-rest. Tags are separated by a pipe character if a contact needs more than one. - Re-import the file. When you import a CSV with contacts that already exist, ChatMitra adds the new tags to those contacts rather than replacing their existing tags or creating duplicates.
- Create two templates in the marketing category, submitted at the same time, differing only in the element you’re testing. Give each URL button its own UTM tag.
- Create two scheduled campaigns with the same send time: one including the tag
abtest-diwali-awith template A, the other includingabtest-diwali-bwith template B. Use the same retry settings in both. The scheduler uses your browser’s local time, so set both campaigns from the same device. - Compare after the window. Each campaign report shows recipients, sent, delivered, read and failed. Clicks per template come from Meta’s template analytics in WhatsApp Manager, and orders from your store’s UTM report.
- Send the winner to
abtest-diwali-restas a third campaign.
What ChatMitra reports, and what you’ll need to collect elsewhere:
| Need | In ChatMitra | Where else |
|---|---|---|
| Sent, delivered, read, failed per campaign | Yes, in the campaign report, with an XLSX export emailed to you | n/a |
| Failure reasons per contact | Yes, with the error code | n/a |
| Button clicks | No | Meta's template analytics (WhatsApp Manager or API) |
| Replies per campaign | No | Count replies in the inbox, or tag responders |
| Orders and revenue | No | Store analytics using the UTM tags |
| Random split | No | Spreadsheet, then tag import |
| Follow-up by report group | Yes: retarget contacts from the sent, delivered, read or failed tab | There's no "delivered but not read" group; "delivered" includes readers |
When not to run an A/B test
Testing isn’t always worth it. Skip it when:
- The list is small and the change is minor. With 400 contacts, you’ll never detect a button-wording difference. Send your best guess and save testing for bigger lists or bolder ideas.
- The message is time-critical. A same-day flash sale can’t wait 72 hours for a verdict. Test the format on an earlier, calmer campaign instead.
- The message is transactional. Order and delivery updates should be clear and consistent, not experiments. If you do test them, change only wording that customers won’t compare.
- The answer is already clear. If a message breaks a rule (a misleading claim, a missing opt-out, a deadline that isn’t real), fix it; don’t test it.
- You can’t act on the result. If legal or brand rules mean only version A could ever go out, testing B wastes messages.
Keep a test log
A test only pays off once, unless you write it down. A simple shared sheet with these columns is enough:
- Date and campaign
- Audience and size per version
- Hypothesis
- What changed (A vs B)
- Primary metric and window
- Results for A and B, with delivered counts
- Chance of the gap being luck (p-value)
- Decision and what you’ll try next
After ten or twenty tests you’ll have something no competitor can copy: a record of what your own customers respond to.
Common mistakes
- Changing several things at once. You’ll get a winner but no lesson.
- Splitting by anything other than chance. Alphabetical, city or signup-date splits create groups that differ before you send a word.
- Sending the versions at different times. Timing becomes a hidden second variable.
- Choosing the metric after the fact. Pick one primary metric before sending.
- Stopping early. A lead in the first two hours is often gone by the next day.
- Testing tiny changes on small lists. Use the sample-size table, or test bolder ideas.
- Ignoring blocks and opt-outs. A variant that sells more but annoys more can cost you the list.
- Comparing an old template with a new one. Template pacing and quality history can treat them differently.
- Treating one result as permanent. Retest important winners, especially novel formats.
Summary
A WhatsApp A/B test compares two versions of one campaign on two random groups, sent at the same moment, judged on one metric chosen in advance. Because each version is its own template, create both together in the same category and language, and keep Meta’s automatic creative changes the same for both. Size the test before you send: small differences need thousands of delivered messages per version, so smaller lists should test bolder changes. Wait out the full window, compare per delivered message, check that failures are balanced, and send the winner to the rest of the list. Then log it. The real payoff is the record of what your customers respond to, built up over many tests.
Sources: Meta for Developers: analytics (template analytics), template pacing, per-user marketing limits, experiments, sending marketing messages (automatic creative optimizations), status messages webhook and pricing. Evan Miller: How Not To Run an A/B Test and sample size calculator. Sample sizes and p-values calculated by ChatMitra with standard two-proportion formulas. Facts checked 28 September 2026 and re-checked 30 September 2026. Rupee message prices are Meta's India rates from 1 October 2026.