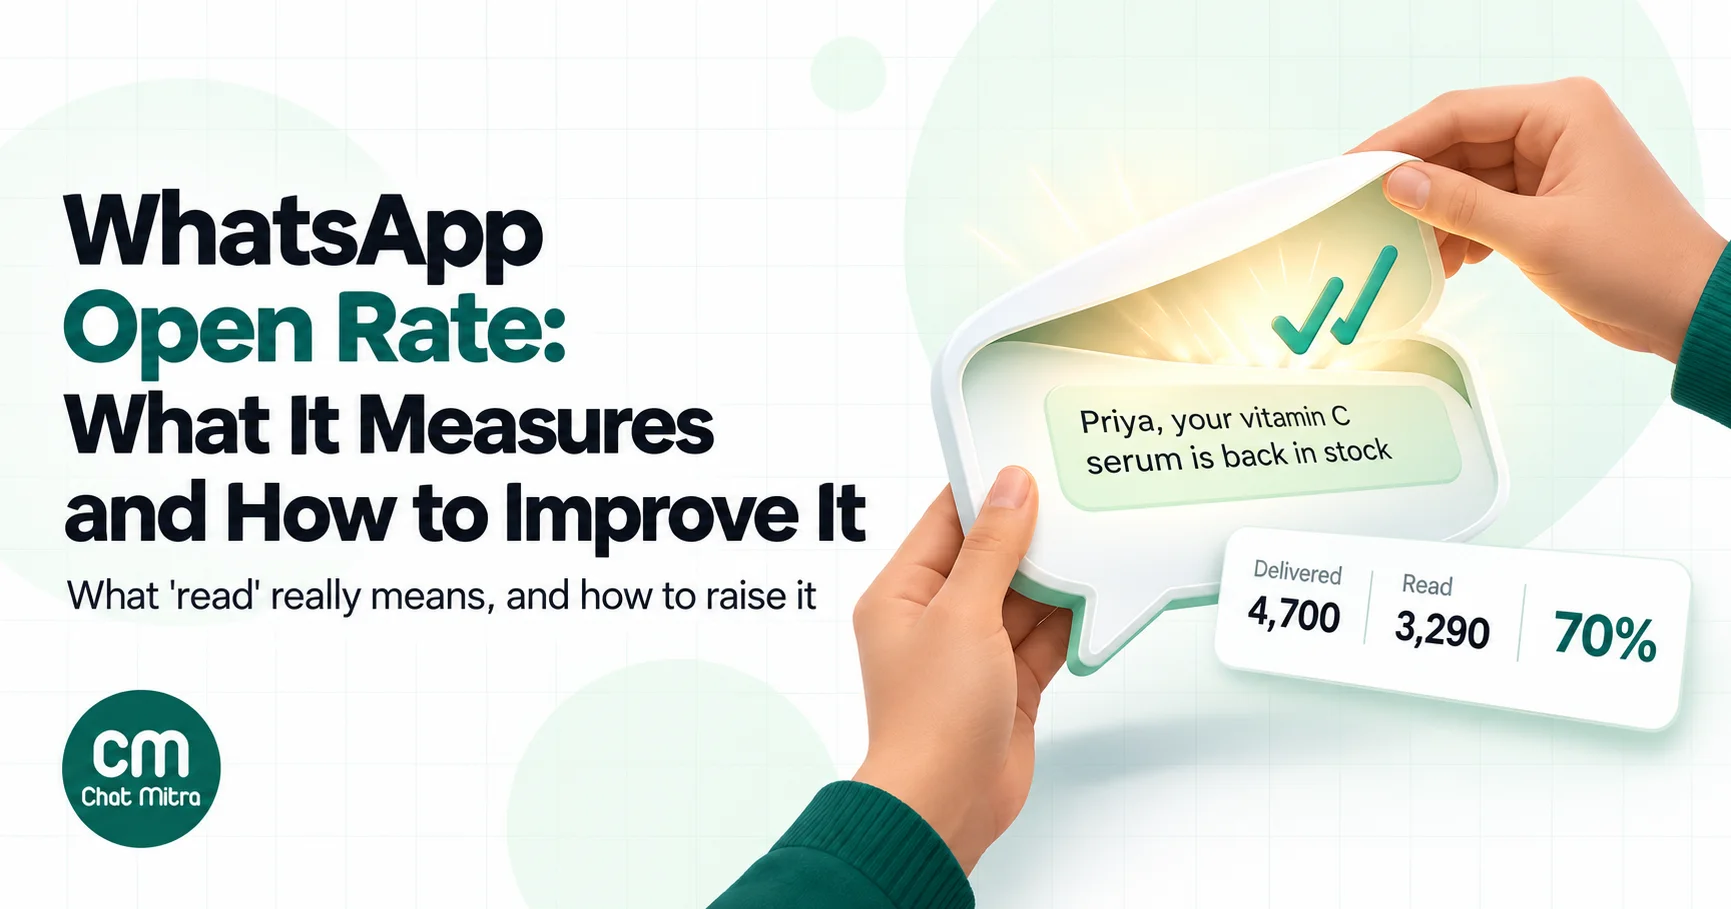
WhatsApp doesn’t have an “open” event. When a dashboard shows a WhatsApp open rate, it’s showing the read rate: the share of delivered messages that reached Meta’s read status. That status means the message was displayed in an open chat on the person’s phone. It doesn’t mean they read every line, and it misses people who have turned off read receipts.
That matters because read rate has become more than a vanity number. WhatsApp uses engagement when it decides how many marketing messages each person receives and when it rates your templates. A campaign that people ignore makes your next one harder to deliver. This guide covers what the number measures, how to calculate it properly, what a realistic benchmark looks like, and the levers that actually raise it, plus how to measure clicks.
Using ChatMitra? Each campaign’s page shows recipients, sent, delivered, read and failed. The percentages are of all recipients, so divide Read by Delivered for a delivered-basis open rate. You can tag the Read group to follow up or to leave non-readers out, and see button clicks in Meta’s WhatsApp Manager. ChatMitra’s fee is ₹0.20 per conversation, not per message. Jump to Measuring open rate on ChatMitra.
What “open rate” means on WhatsApp
Meta’s status webhooks report each message through a few stages. Every WhatsApp metric comes from these:
| Status | What Meta says it means | What it tells you |
|---|---|---|
| Sent | The message left Meta’s servers for the person | Meta accepted your template and the request |
| Delivered | The message reached the person’s device | The number is valid and on WhatsApp, and limits didn’t block it |
| Read | The message was “displayed in an open chat thread” on the device | The person opened the chat with your business |
| Failed | The message couldn’t be sent or delivered | Something is wrong with the number, your template or a limit |
| Clicked | A URL or quick-reply button in the template was tapped (template analytics) | The message made someone act |
A few details trip people up:
- Read implies delivered. If someone is already in your chat when the message arrives, it’s delivered and read at the same moment, and Meta sends only the read status. A report that counts “delivered” and “read” as separate buckets can make delivery look lower than it is. Count delivered as delivered or read.
- Read isn’t attention. The status fires when the message is on screen in an open chat. A person who opens the chat to delete it still counts as a read.
- There’s no open without a read. WhatsApp’s chat list shows a preview of your message, and some people decide from that preview alone. They never open the chat, so they never count, even if the preview did its job.
How to calculate WhatsApp open rate, delivery rate and click rate
Use delivered messages as the base for read rate. Messages that never arrived can’t be read, so including them punishes you for list quality, not message quality.
| Metric | Formula | What it diagnoses |
|---|---|---|
| Delivery rate | Delivered ÷ sent | List quality, invalid numbers, per-user limits |
| Read (open) rate | Read ÷ delivered | Sender trust, relevance, timing, the first line |
| Click rate | Button clicks ÷ delivered | The message as a whole |
| Click-to-read rate | Button clicks ÷ read | The offer and the button, for people who read it |
| Opt-out rate | Stop requests and Stop promotions ÷ delivered | Whether you’re sending what people agreed to |
Example: a broadcast is sent to 5,000 contacts. 4,700 are delivered, 3,290 are read and buttons are tapped 410 times.
- Delivery rate: 4,700 ÷ 5,000 = 94%
- Read rate: 3,290 ÷ 4,700 = 70%
- Click rate: 410 ÷ 4,700 = 8.7%
- Click-to-read rate: 410 ÷ 3,290 = 12.5%
If a tool reports “open rate” as read ÷ sent, the same campaign shows 3,290 ÷ 5,000 = 65.8%. Neither is wrong, but they aren’t comparable. Always check which base a number uses before you compare it with anything. Our template analytics guide explains where Meta shows these numbers for each template.
Why your reported read rate is probably too low
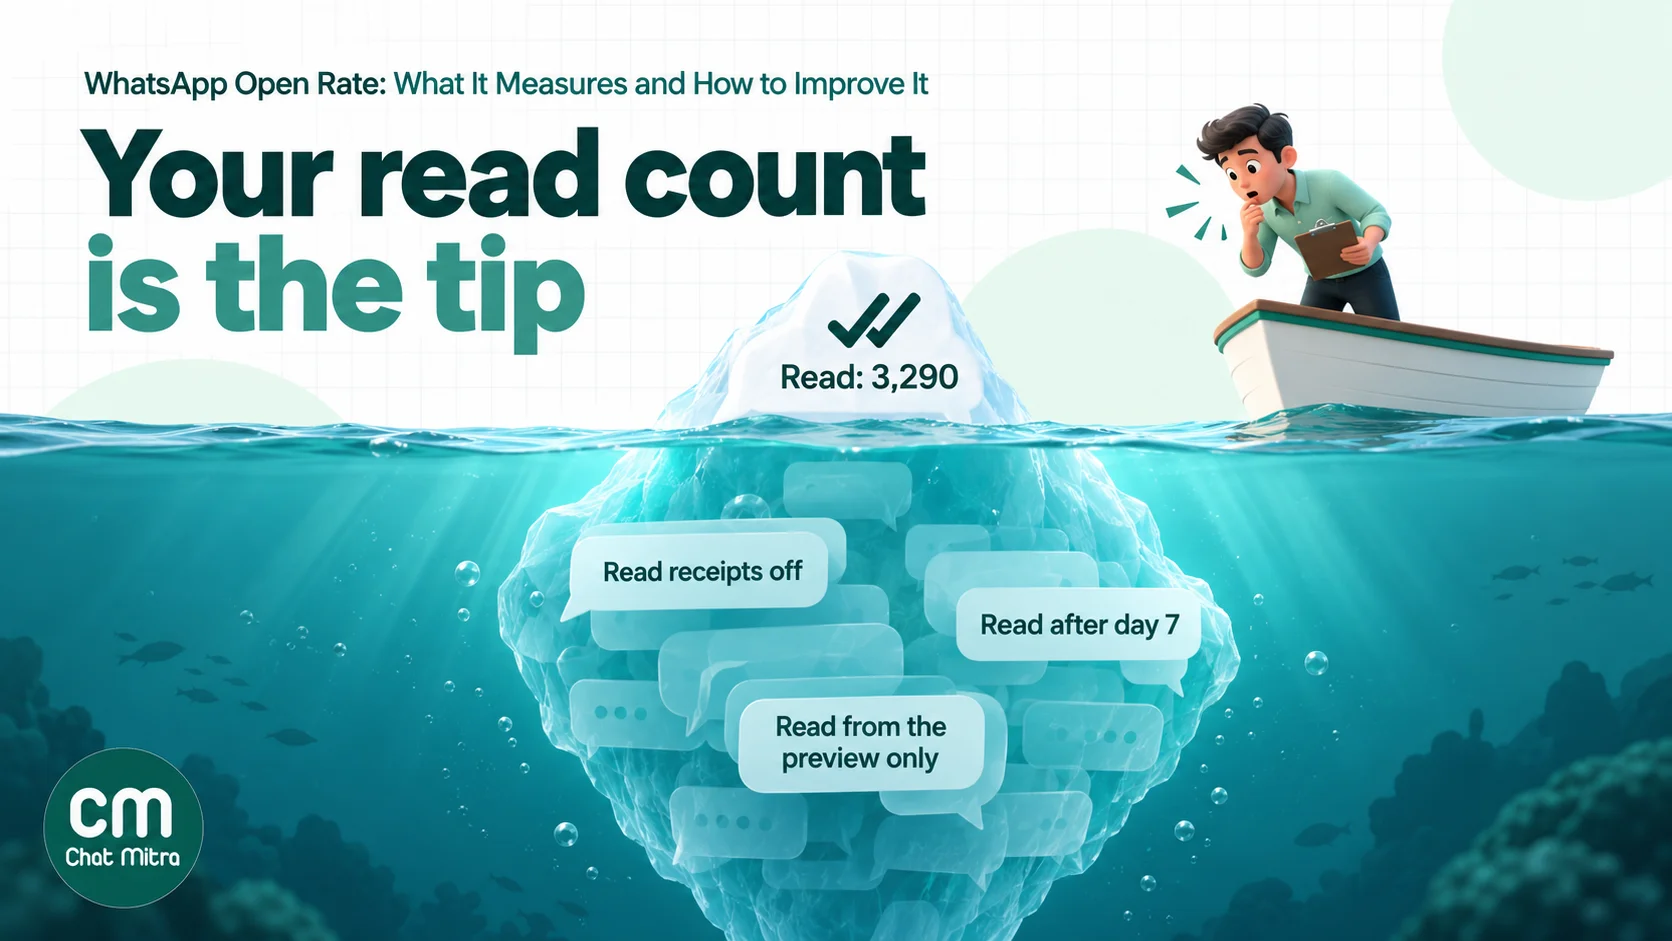
Several things make the measured number lower than the real one:
- Read receipts switched off. WhatsApp users can turn off read receipts in their privacy settings. The benchmark study below notes that these recipients count as unread even when they’ve seen the message, so measured read rates understate real ones.
- The 7-day window. Meta’s template analytics record read and click events for up to 7 days after a message is sent. Someone who opens your message on day 9 never counts.
- Daily data in UTC. Template analytics are reported per day in UTC. Comparing a campaign sent at 9 pm IST on one day with one sent at 9 am on another can split results across days in confusing ways.
- Reading too early. A broadcast sent in the evening keeps collecting reads the next morning. Judge it after a fixed period, such as 48 hours or 7 days, and use the same period every time.
- Previews that do the job. If your first line gives the whole message (“Your order #4512 has shipped”), many people won’t open the chat. A low read rate on an informational message can mean it worked.
None of this is a reason to ignore read rate. It’s a reason to compare like with like: the same template type, the same audience and the same measurement window.
What is a good WhatsApp open rate?
You’ll see “98% open rate” on many vendor pages, including in the search results for this topic. There’s no public Meta source for it, and the measured data that exists is lower.
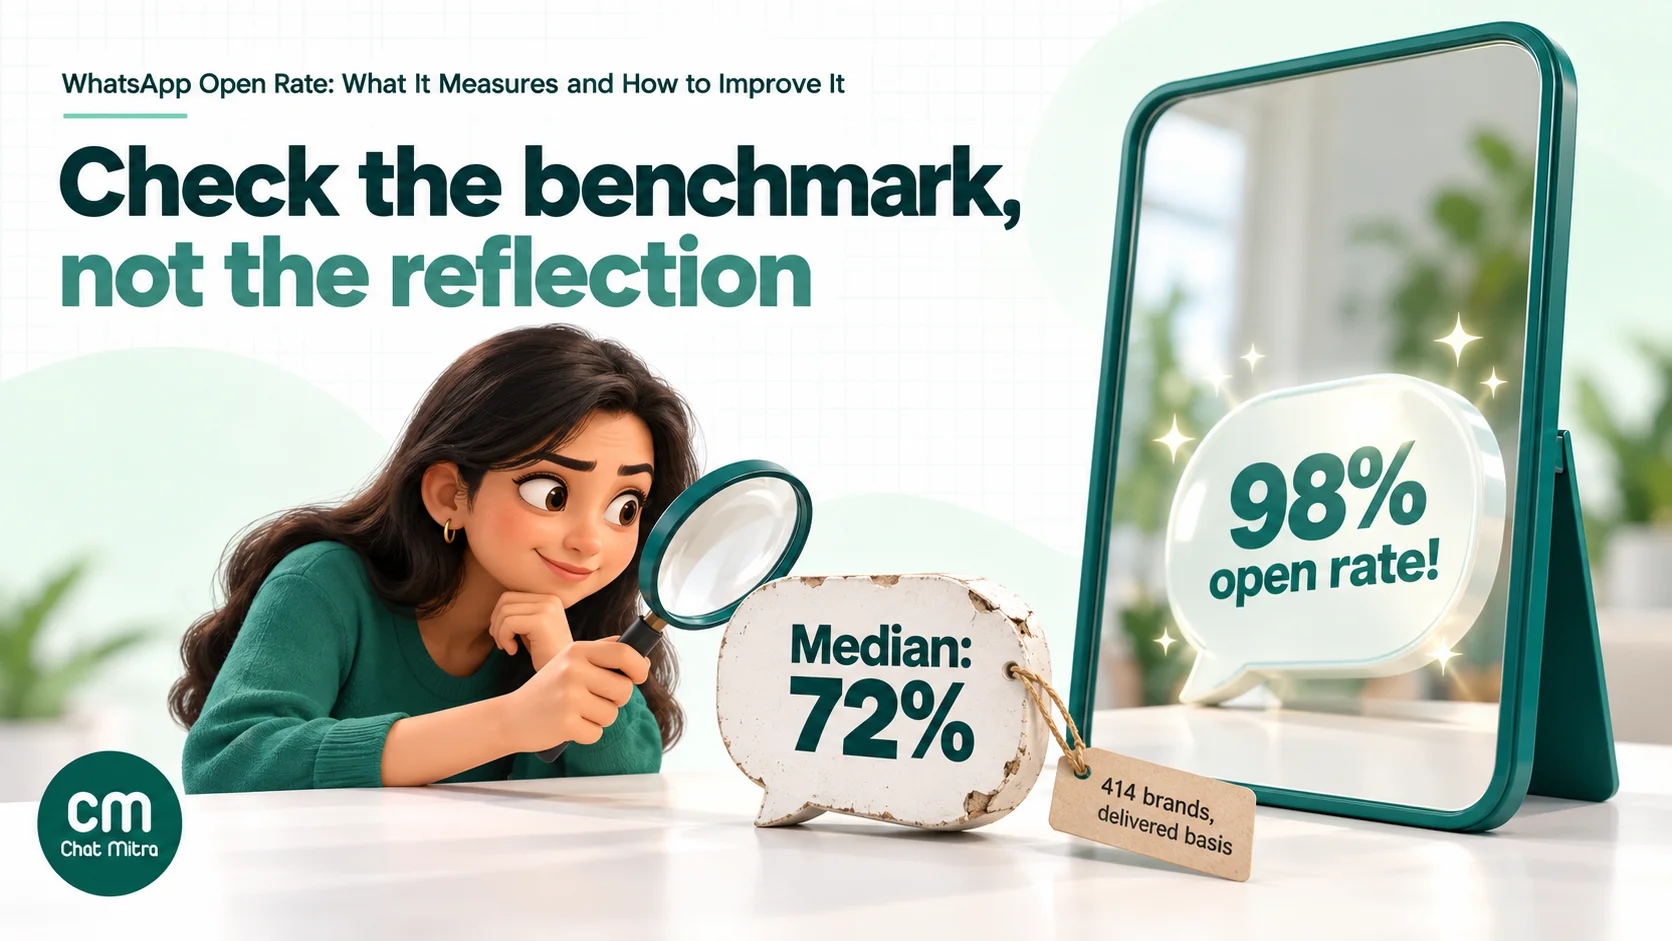
The most transparent study we found is Chatarmin’s WhatsApp Open Rate Benchmark 2026, which publishes its method:
- Median per brand: 72.05% of delivered campaign messages were read (414 brands, March to May 2026).
- Message-weighted average: 79.6%, higher because large senders with high rates count more.
- On a sent basis, 65.2% for the same platform from June 2025 to February 2026. The roughly 14-point jump came from changing the denominator, not from better campaigns.
- No account reached 98% as a campaign average.
Treat even this with care. The sample is that platform’s own customers, mostly ecommerce brands, and the study says itself that it isn’t representative. It counts campaigns only, not automated flows such as order updates, so don’t compare it with transactional messages.
Some providers say Meta considers 65–80% a satisfactory read rate for marketing templates. We couldn’t find that range in Meta’s public documentation, so use it as a rough guide, not a threshold. If you send through the Marketing Messages API, Meta’s benchmarks feature compares your read and click rates with similar templates from other businesses in your region, which is a fairer comparison than any blog average.
The most useful benchmark is your own history: read rate by template type, segment and day of the week, tracked over months. A drop from your usual 75% to 60% tells you far more than a comparison with someone else’s average.
Read rate by message type
Not every message should be judged by read rate, and mixing types in one report hides what’s going on.
| Message type | How to judge it | Why |
|---|---|---|
| Marketing (offers, launches, newsletters) | Read rate, click rate, opt-outs, orders | People didn’t ask for this particular message, so attention has to be earned |
| Utility (order, delivery, appointment, payment updates) | Delivery rate first, then read rate | People are waiting for these; a failed delivery matters more than a slightly lower read |
| Authentication (one-time passwords) | Delivery speed and completion of the login | People can often copy or autofill the code without opening the chat, so read status says little |
| Service (your replies inside the 24-hour window) | Response time and whether the issue was resolved | The customer started the conversation, so they’re already reading |
Report marketing campaigns separately from transactional messages. A dashboard that averages delivery updates people were waiting for with promotions they weren’t tells you nothing about either.
Why read rate matters more than it used to
For a long time, read rate was a number for reports. Now it changes what you can send.
- Per-user marketing limits. WhatsApp limits how many marketing templates each person receives from all businesses, based on “a dynamic view of an individual’s recent marketing message read rate” and how busy their inbox is, according to Meta’s per-user limits page. People who rarely read marketing get fewer marketing messages delivered, and your sends to them fail with error 131049.
- Template quality. Meta rates each template green, yellow or red from negative feedback and low read rates. A template that reaches red is paused for 3 hours, then 6 hours, and then disabled.
- Quality-based delivery. On the Marketing Messages API, Meta factors whether a message is high-engagement into delivery decisions and says this delivers up to 9% more messages than the Cloud API. Messages people expect and read get the benefit.
So a broadcast to a large, cold list doesn’t just waste money on unread messages. It lowers the signals that decide whether your next campaign gets through.
Ten ways to improve your WhatsApp open rate
1. Send only to people who asked to hear from you. The biggest single factor is whether the person expected your message. Meta’s opt-in rules require consent that names your business, and its tips recommend opt-in that covers the kinds of messages you’ll send. A list built from old CRM exports or bought data usually brings a low read rate and more blocks, whatever the message says. Our WhatsApp opt-in guide covers how to collect consent properly.
2. Make the sender instantly recognisable. In the chat list, people see your display name and profile photo before anything else. Use the name customers know you by (the shop name, not the legal entity) and a clear logo that works at thumbnail size. See our guides to display names and the business profile. Verification marks such as the green tick or Meta Verified can add trust, but they don’t fix an irrelevant message.
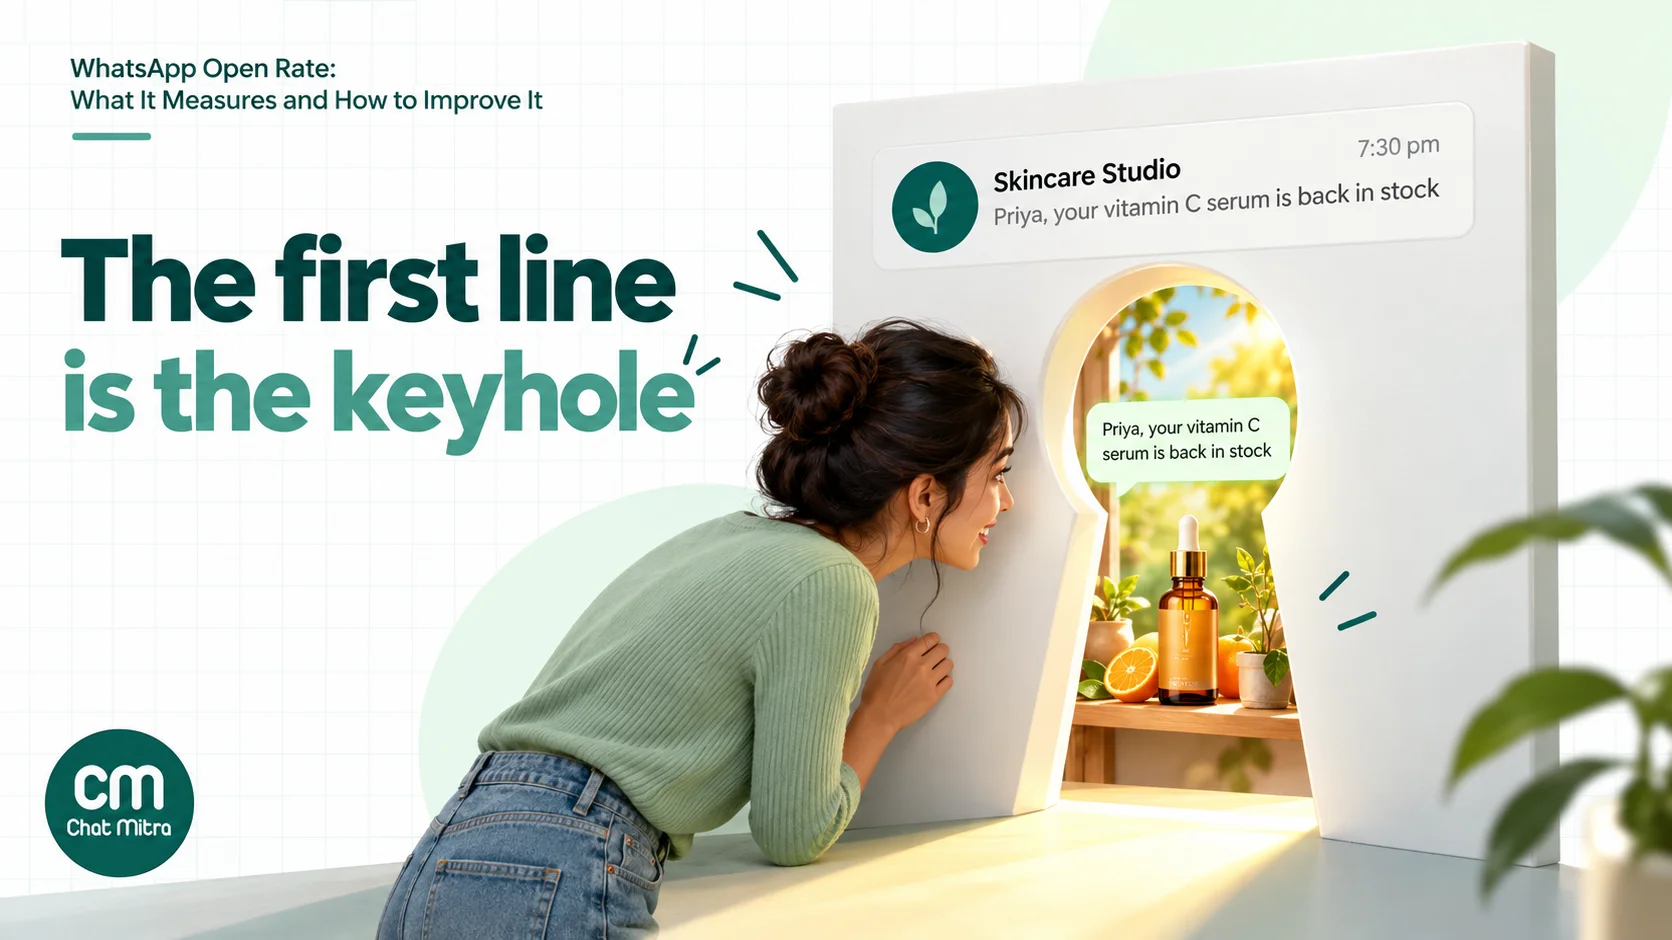
3. Put the point in the first line. The chat list shows only the start of your message. Providers commonly suggest getting the main point into the first 60 to 65 characters. That’s a rule of thumb, not a Meta rule, but the idea holds: “Hi Ravi, your 20% off ends tonight” beats “Hi Ravi, we hope you’re having a wonderful week!”.
4. Segment instead of blasting. Split your list by what people bought, where they live, which language they prefer and how recently they engaged. A smaller message sent to the right segment gets a higher read rate than the same message to everyone, and it protects your template quality.
5. Personalise the parts that matter. A name is a start. A product they bought, their city or their appointment date is better, because it shows the message is about them.
6. Choose the time for your audience. Office workers, shop owners and students check their phones at different times. Meta’s own advice, relayed by several providers, is to avoid days when many businesses compete for attention, such as weekends and seasonal peaks. Test two or three sending times for your audience instead of copying someone else’s “best time”.
7. Cap how often each person hears from you. Frequency is the quiet killer of read rates. Decide a maximum, for example one promotional message a week, and keep a record of when each person last received one.
8. Stop sending to people who never read. If someone hasn’t read your last five or six marketing messages, the next one is unlikely to land, and it drags down your template’s signals. Move them to a low-frequency list, or try one honest “do you still want these?” message and remove them if they don’t respond. Our win-back campaigns guide covers how to approach customers who’ve gone quiet.
9. Use a header that earns attention, but don’t rely on it. An image or video header makes the message stand out once the chat is open, but people decide whether to open it from the chat list, so the first line still has to work.
10. Watch quality ratings and fix weak templates early. Check each template’s quality rating after every campaign. If one turns yellow, change its audience, timing or content before it turns red and gets paused. Our WABA health and quality rating guide explains the signals.
First lines that get opened
The chat list shows your sender name, a time and the start of the message. Here’s how the opening changes what people see:
| Business | Weak first line | Stronger first line |
|---|---|---|
| D2C skincare | ”Hello! We hope you’re doing well and taking care of your skin." | "Priya, your vitamin C serum is back in stock” |
| Coaching institute | ”Dear student, greetings from our academy." | "Mock test results for Batch B are out, Ravi” |
| Salon | ”Hi! We have something special for you this festive season." | "Diwali slots are filling up: 3 left on Saturday” |
| Real estate | ”Greetings from our team. Please find details of our new project." | "Wakad 2 BHK site visits this Sunday, Amit: book a slot” |
| Restaurant | ”Hello foodie! Exciting news inside!" | "New thali menu from Friday, 15% off for regulars” |
The stronger versions name the person or their interest, say what’s new, and give a reason to open now. They don’t use more emojis or capital letters. For complete message ideas, see our WhatsApp broadcast message examples.
How to improve click rate
A read is only useful if it leads somewhere. Clicks are what connect a WhatsApp message to an order, a booking or a reply.
- Give one clear action. A message with three buttons pointing to three places gets fewer clicks than one with a single obvious next step.
- Write buttons as outcomes. “See today’s deals” or “Book my slot” work better than “Click here”.
- Use the right button type. URL buttons send people to a page; quick-reply buttons let them answer in the chat, which keeps the conversation going and opens a 24-hour customer service window. Meta’s template analytics count both.
- Make the landing page match the message. If the message promises 20% off running shoes, the link should open the running shoes with the discount applied, not the home page.
- Tag your links. Add UTM parameters to button URLs so WhatsApp visits show up as their own source in your web analytics. Meta can also add its own link tracking to report website clicks; you can switch that off per template.
- Measure clicks over the same window. Meta counts clicks for up to 7 days after sending, so compare campaigns over the same period.
Diagnose a low read rate
| What you see | Likely cause | What to try |
|---|---|---|
| Delivery rate below about 90% | Old or invalid numbers, numbers not on WhatsApp, per-user limits | Clean the list, remove repeated failures, check for 131049 errors |
| Read rate low across every campaign | Sending to people who didn’t expect you, or an unrecognisable sender | Check consent and audience source; fix display name and photo |
| Read rate falling month by month | Too many messages to the same people | Lower frequency, rest non-readers |
| One segment much lower than others | Wrong offer, language or time for that group | Rewrite for that segment or send less to it |
| One template much lower than others | Weak first line or a confusing purpose | Rewrite the opening and test it against the old version |
| High read rate, very few clicks | The message is seen but the offer or button doesn’t persuade | Change the offer, the button text or the landing page |
| Blocks or Stop promotions rising | Messages feel unwanted | Pause the segment, check opt-in, send less |
Test changes properly
Changing three things at once and comparing with last month tells you very little. To know whether a new first line or sending time works:
- Pick one change, such as the first line.
- Split the same audience randomly into two groups of a few hundred or more.
- Send both versions at the same time.
- Compare read rate and click rate after the same window, such as 48 hours.
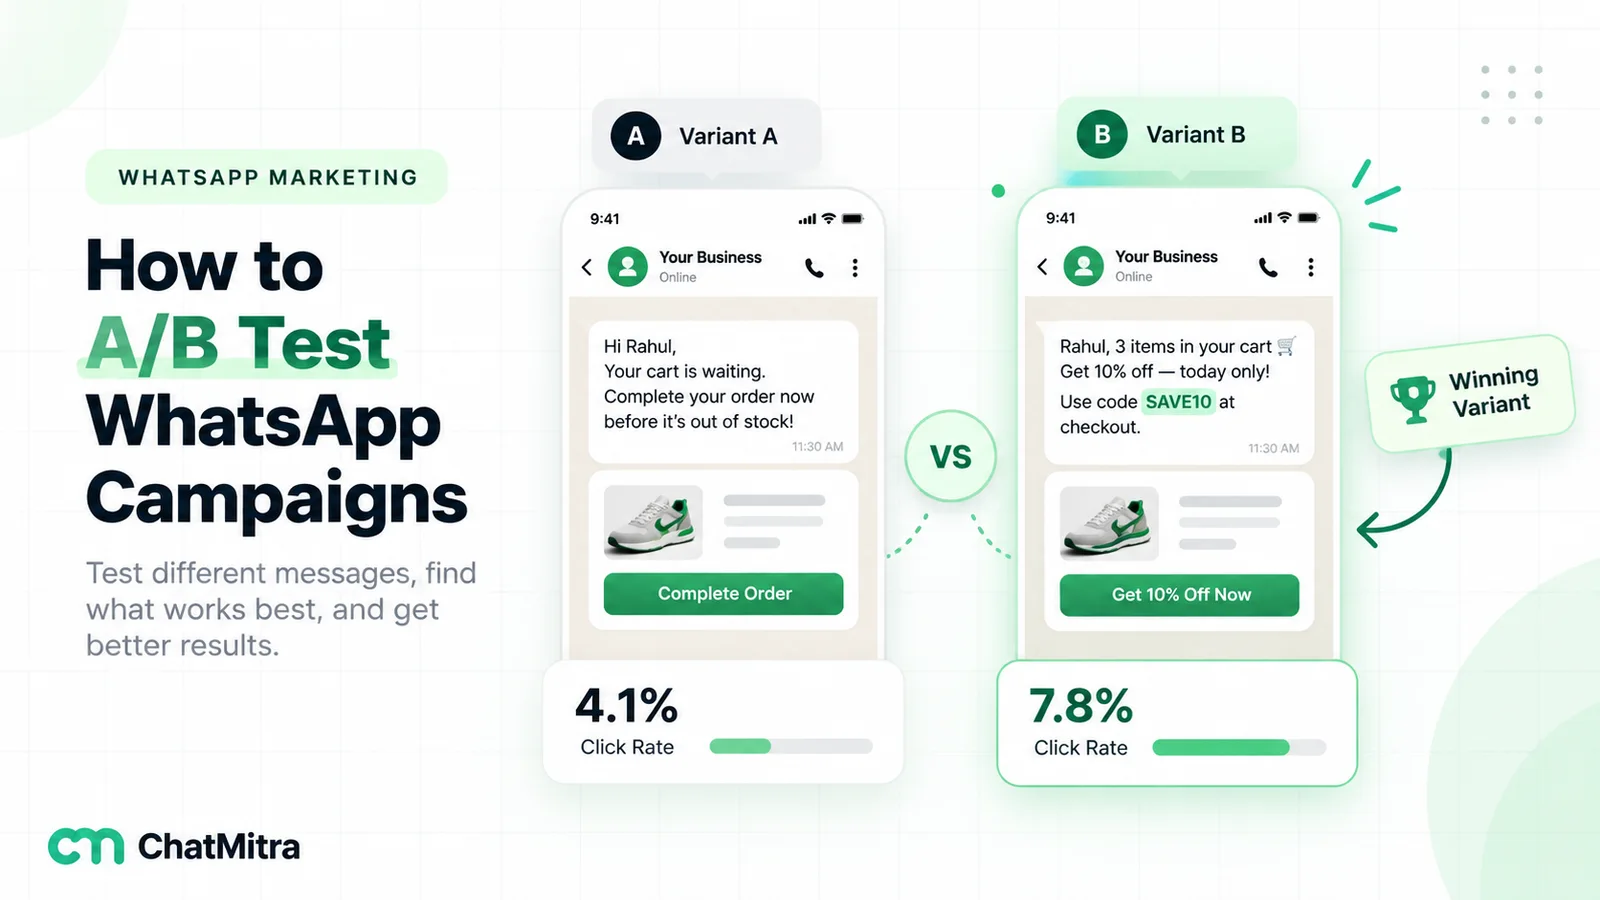
Our guide to A/B testing WhatsApp campaigns covers group sizes and how to read the results.
A simple campaign report
Keep one row per campaign in a shared sheet. After a few months it becomes the benchmark that matters most: yours.
| Column | Example | Why it’s there |
|---|---|---|
| Date, time and day | Thu 7 Nov, 7:30 pm | Spot timing patterns |
| Template and category | diwali_offer_1 (marketing) | Compare like with like |
| Segment | Repeat buyers, Pune, English | Find which audiences respond |
| Sent / delivered / read | 5,000 / 4,700 / 3,290 | Delivery and read rate on a delivered basis |
| Clicks | 410 | Click rate and click-to-read rate |
| Replies | 85 | Conversations started |
| Orders or bookings | 62 | The result that pays for the send |
| Opt-outs and blocks | 9 | Early warning on list fatigue |
| Measured after | 7 days | Keeps campaigns comparable |
| Cost | Meta charges plus platform fees | Cost per order, not cost per read |
Common mistakes
- Comparing numbers with different bases. Read ÷ sent and read ÷ delivered can differ by more than ten points for the same campaign.
- Quoting 98% as a target. It sets an expectation no real campaign meets and hides real problems.
- Judging a campaign after an hour. Reads keep coming in for days.
- Treating read rate as success. A read with no click, reply or order didn’t earn anything.
- Blasting the whole list. A bigger send with a lower read rate can mean fewer total results and worse template quality.
- Ignoring non-readers. Contacts who never read your messages lower your quality signals every time you send.
- Hiding the point. A first line full of greetings wastes the only part of the message people see before deciding to open.
- Mixing campaign and transactional numbers. Order updates and appointment reminders are messages people are waiting for, so their read rates behave differently from promotions. Report them separately.
Measuring open rate on ChatMitra
ChatMitra runs on the official WhatsApp Business API, and campaigns that use a marketing template are sent through Meta’s Marketing Messages API. Every campaign has its own results page, and contacts can be grouped by what happened to their message.
| ChatMitra advantage | What it means for open rate | How it compares |
|---|---|---|
| ₹0.20 per conversation, never per message | A customer who reads, replies and asks questions within 24 hours counts once | Per-message platform fees grow with every reply |
| Results by status for every campaign | Counts and percentages for recipients, sent, delivered, read and failed, with failure reasons | Each contact is counted once, at their furthest status |
| Tag or retarget a status group | Tag everyone who read a campaign, or send a new template to the Delivered, Read or Failed group | Follow up with readers and rest non-readers |
| Tags to include or exclude | Build segments by purchase, city, language or engagement, and include or exclude them per campaign | Smaller, better-targeted sends |
| Marketing campaigns on the Marketing Messages API | Your marketing sends use Meta’s newer API, where engagement factors into delivery | Meta reports clicks and cost per click in WhatsApp Manager |
| Business profile editing | Update the about text, description, website, email, address and profile photo from ChatMitra | Keep the sender recognisable |
| Scheduling | Send a campaign at a chosen date and time | Test sending times without staying up |
| Enterprise (₹2,499/month) removes the fee | High-volume senders pay a flat platform fee | Starter is free; Pro is ₹999/month |
How to work out your real open rate in ChatMitra:
- Open the campaign’s results and note the Delivered and Read counts.
- Divide Read by Delivered. The Delivered count already includes messages that were read, because each contact is counted once at their furthest status. The percentages on the page are of all recipients, failed numbers included, so they read lower than a delivered-basis rate. For example, 3,290 read out of 4,700 delivered is 70%, while the page shows 3,290 out of 5,000 recipients, or 65.8%.
- Check failures in the Failed group and their reasons before blaming the message: a high failure count points to the list or to per-user limits, not to the content.
- Compare after the same period. Note the counts 48 hours and 7 days after each send, so campaigns sent at different times are judged the same way.
How to act on it:
- Follow up with readers. In the campaign’s customer list, open the Read tab and tag everyone in it (for example
read-diwali-1). Include that tag in your next, more specific message. - Rest non-readers. Tag the Delivered group as well. Delivered contacts who don’t carry the read tag never opened the message; leave them out of the next few promotional sends.
- Track clicks with Meta and UTM tags. ChatMitra doesn’t count button clicks. Open the template’s insights in WhatsApp Manager for link clicks, and add UTM parameters to your button URLs so visits appear in your web analytics.
- Read replies in the inbox. Replies to campaigns land in the shared inbox as normal chats; there’s no replied count in the campaign report.
Good to know:
- The campaign chart is a summary of the final counts, not an hour-by-hour timeline.
- Template quality ratings aren’t shown in ChatMitra; check them in WhatsApp Manager. The phone number’s quality rating and messaging limit tier are shown in ChatMitra’s top bar.
- There’s no built-in frequency cap. Keep a tag or a contact field with the date of each person’s last promotional message and exclude recent recipients.
- Display name changes are made in WhatsApp Manager and reviewed by Meta.
- Check the pricing page for what your plan includes.
Where to start
Pull your last five campaigns and calculate read rate on a delivered basis for each, split by segment. Find the lowest one, change one thing (the audience, the first line or the sending time), test it against the old version and compare after the same window. Fix the sender name and photo if customers wouldn’t recognise them, and set a frequency cap. These steps usually do more for your open rate than any single clever message.
Sources
- Meta for Developers: Status messages webhook reference, Analytics (template analytics), Per-user marketing template message limits, Template quality rating, Template pausing, Marketing Messages API features, Viewing metrics, Get opt-in for WhatsApp. All read on 22 October 2026.
- Chatarmin: WhatsApp Open Rate Benchmark 2026 (median, weighted average and measurement basis from 382 brands).